


The performance of the cooling plant at a thermal power station or data centre is critical to efficient operation. Monitoring fan motor load gives operators a low-cost way to improve monitoring of mechanical-draft wet cooling towers and air-cooled condensers (ACCs), detect deteriorating fan and drive condition, and optimise fan control to reduce operating costs. The approach is designed for easy retrofit into existing plants.
The fan is a critical element of an induced-draft tower or air-cooled condenser, and fan motor load is a key parameter for monitoring how it performs. Motor load is best measured as active power (kW), which, unlike motor current, varies approximately linearly with load.
Load Controls power sensors measure three-phase current and voltage with a fast response. They work with both fixed-frequency and variable-frequency drives and can be installed anywhere between the motor control cabinet and the fan motor. The signal is sent to the plant distributed control system (DCS), or to a separate monitoring workstation in the control room, over existing wiring or a wireless link. Other field measurements such as fan speed or cooling airflow can be added where available.
Combined with tower design and test data and other plant parameters from the DCS or data historian (cooling water inlet and outlet temperatures, ambient temperature, condenser pressure), the power signal supports a set of performance indicators. For a typical multi-cell induced-draft tower these might include:
Tetra Distribution supplies the Load Controls sensors. Tetra Engineering, part of the same group, can help integrate them with your existing DCS and develop the application that processes the field data to calculate cooling performance and identify anomalies, with process displays, alarm logs and historical records that give a complete view of cooling plant operation.
Recommended products: Model UPC Adjustable Capacity Power Sensor, UPC-MB Modbus-Enabled Universal Power Cell, PH-1000 Power Cell Monitor for larger fan motors
Further reading: IIoT and control system integration, Why measure power, not amps
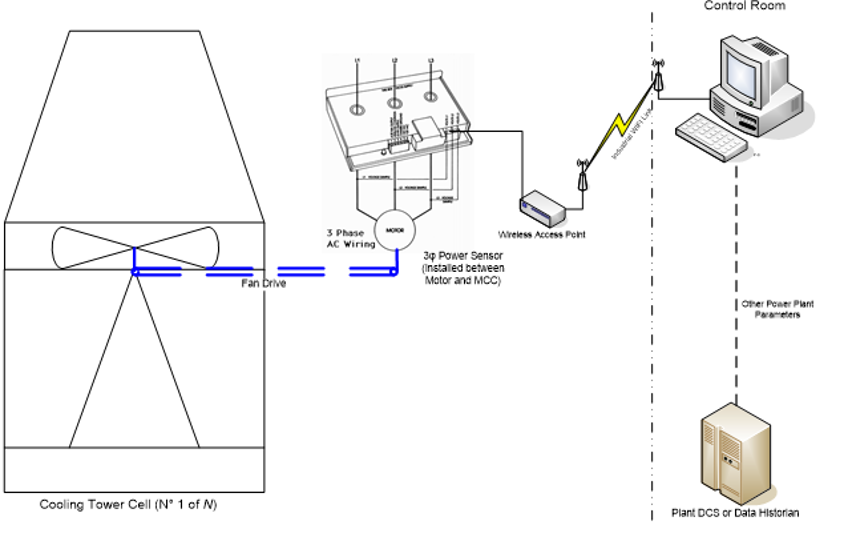
How it works: a three-phase power sensor installed between each fan motor and its motor control centre sends fan power to the plant DCS or data historian over existing wiring or a wireless link.
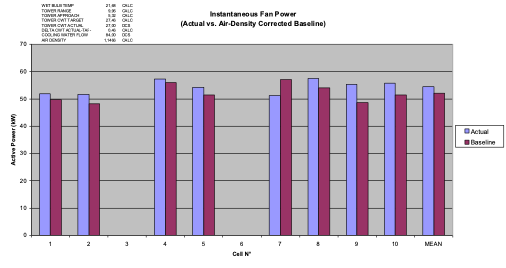
Example output for a 10-cell induced-draft cooling tower: measured fan power in each cell compared with an air-density-corrected baseline. Cells 3 and 6 show no reading in this snapshot.

Tell us the application, motor size and drive type. We will recommend a model and send you a quotation. 12-month warranty and support from our team in France.
